Maia Kapur publishes article in Biological Conservation

Maia Kapur, a new PhD student in the Punt Lab, recently published a simulation study with coauthors in Biological Conservation on the accuracy of simple fisheries indicators in predicting the status of pelagic shark populations. Fisheries indicators, such as time series of average length or catch per unit effort, are used in some data-limited or bycatch fisheries to perform rough population status estimates. This study demonstrated that such approaches pose the risk of being very inaccurate, especially when the time series is short.

Maia will be presenting this work at the SAFS Grad Student symposium in November.

Carvalho, F., Piner, K.R., Lee, Hui-Hua, Kapur, Maia, Clarke, S., 2018. Can the status of pelagic shark populations be determined using simple fishery indicators? Biol. Conserv. 228, 195–204.

Modeling the spatio-temporal dynamics of one little bugger – delta smelt in the San Francisco Estuary

Noble Hendrix1 and Erica Fleishman2

1QEDA Consulting
2Dept. of Fish, Wildlife and Conservation at Colorado State University
October 30, 2018 9:00 (PST): FSH 203

Modeling the spatio-temporal dynamics of one little bugger – delta smelt in the San Francisco Estuary

Delta smelt are an annual estuarine fish that complete their life-cycle in the San Francisco Estuary. They were listed as threatened under the Endangered Species Act in 1993 and have continued to decline since then. As a result, there is interest in determining how management of water flow through the estuary may affect the population dynamics of the species. Focus has turned to factors that affect survival and movement in the fall and in the spring, and here we are interested in evaluating the fall. We have constructed a spatially explicit model that estimates survival and movement as functions of covariates in four regions of the estuary. This framework allows an explicit examination of hypotheses regarding the role of environmental drivers on these processes. The model also includes the probability of capture for spatial replicates within each region. We have developed the model in Stan and have fit to simulated data with well-behaved statistical properties; however, the catch data are zero-inflated and over dispersed. We investigate several alternatives including zero inflated Poisson and zero inflated negative binomial for the likelihood and present the results of fitting several conceptual models developed from recovery plans. We are interested in evaluating approaches for model averaging and model goodness of fit. With respect to the latter, we are developing metrics that highlight spatio-temporal patterns in model weaknesses to help generate the next round of conceptual models.

Punt Lab does CAPAM Spatial Assessment Workshop

Last week, Punt lab members Maia Kapur and Caitlin Allen Akselrud in addition to André himself attended the Center for the Advancement of Population Assessment and Modeling (CAPAM) workshop at the SW Fisheries Science Center. The workshop was focused on spatial methods in stock assessment and fisheries population modeling. André delivered a keynote speech providing an overview of cases where including spatial structure in an assessment model improved precision and/or reduced bias — but results are case-dependent. Panelists agreed that the general ‘fleet-as-area’ approach, presented by Punt lab researchers here, is a workable alternative assuming that the areas are consistent with indices of abundance.

Several SAFS alumni, including Dr. Juan Valero (Hilborn lab, now at IATTC) presented ongoing work contributing to the upcoming Bigeye Tuna (BET) assessment.

The workshop generated much discussion, especially regarding the issue of accurately including movement from tagging data into stock assessments and the importance of defining stock structure at a scale useful for management. We look forward to the special issue of Fisheries Research dedicated to this workshop!

Simulating marine mammal bycatch impacts in data-poor situations

Margaret Siple1
1SAFS
October 16, 2018 9:00 (PST): FSH 203

Simulating marine mammal bycatch impacts in data-poor situations

Simulation can be used to explore the expected outcomes of management actions when data on marine mammal abundance and bycatch are sparse or unavailable. For governments interested in evaluating their marine mammal bycatch with respect to regulations or instituting new changes (e.g., gear modifications or new bycatch limits), simulation can be a useful tool for exploring how marine mammal populations might respond to these actions. One of the work products of the Ocean Modeling Forum’s Marine Mammal Bycatch Working Group will be a tool that allows users to visually explore the impacts of different bycatch management actions on marine mammal abundance, given limited information about the fishery or the marine mammal of interest (i.e., abundance, current bycatch rate, and productivity).

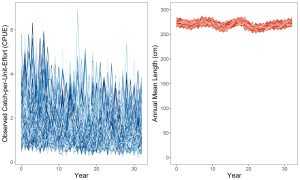
The tool allows users to compare outcomes among various bycatch and starting abundance scenarios. It operates at different levels of complexity, using inputs chosen by the user in an age-structured model that projects abundance into the future, given estimates for abundance and bycatch rates. Users can apply specific life history parameters or choose from a list of life history types (humpback whale, bottlenose dolphin, bowhead whale, pinniped, or the ‘generic’ life history type used in the original simulations for PBR). Outputs include abundance trajectories under different management scenarios, and performance with respect to management objectives.

In the future, the tool will also be able to be used to find the strategy most likely to meet certain management objectives and explore the impacts of additional mortality besides bycatch (e.g., ship strikes). This talk will demonstrate the tool’s current capabilities and discuss some of the expansions to the current model, including ways to incorporate non-bycatch mortality and how to “back-calculate” strategies based on management objectives. I would also like to solicit feedback on some of the options for visualizing outputs.